The British Library ran an exhibition called 'Beautiful Science' — exploring how data visualisation has helped convey scientific and medical information in ways that save lives. It prompted me to pick up the thread on data storytelling once more.
The image that inspired this post was constructed by William Farr in 1852 and shows the impact of Cholera. What makes it so beautiful is that it isn't merely aesthetically pleasing — it communicated the underlying data far more effectively than any equivalent tabular format. And 'effective' in this context means that people's lives could actually be saved, because the spread of the disease could be more readily understood at a glance.
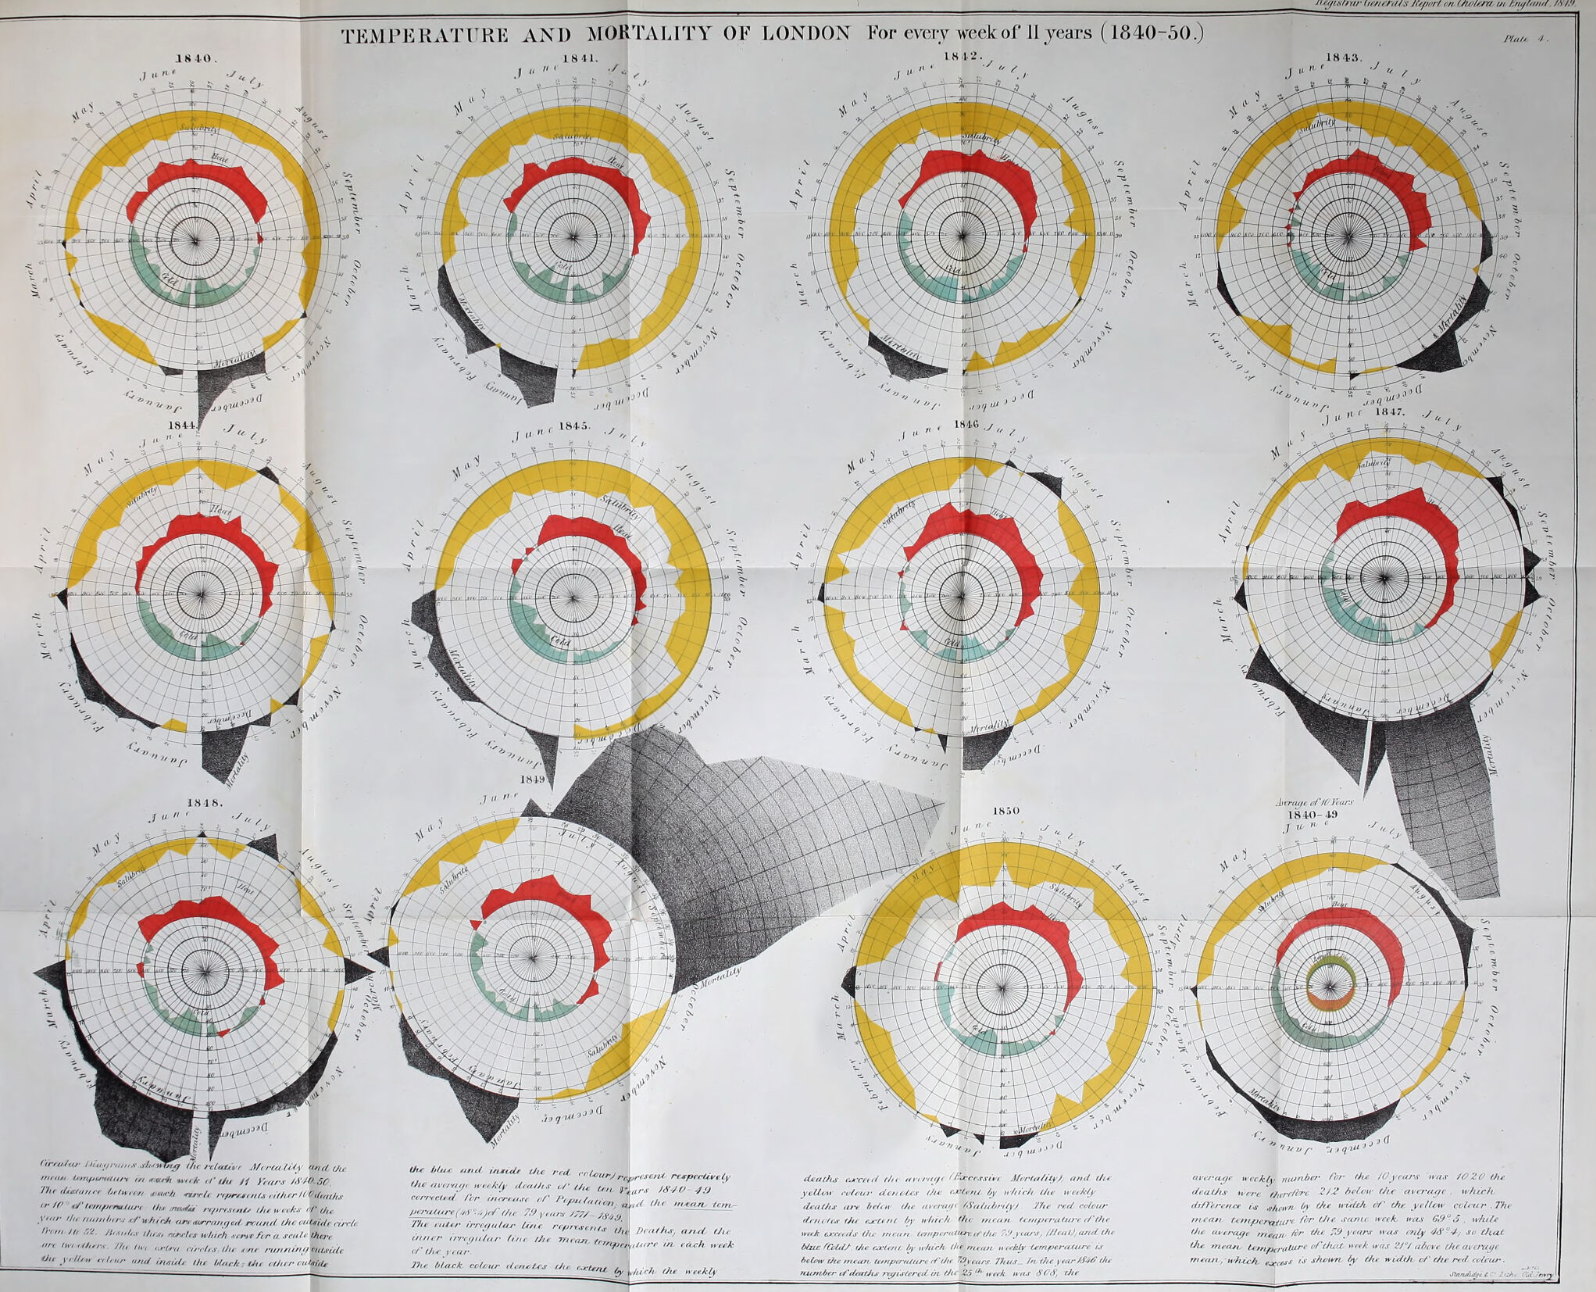
You can see the orginal here: Wellcome collection: Report on the mortality of cholera in England, 1848-49
Whilst I cannot claim anything as laudable as fighting a cholera epidemic, I still aspire to the same underlying principle: ensuring that data are communicated in an effective manner. The art of storytelling is something I believe everyone involved in communication needs to master.
Ensuring that the way you communicate is engaging and, most importantly, relatable for your audience is key — whether you're presenting web analytics, voice of customer data, or anything else.
Step 1: Be interestingWhy visualisation saves time, not just comprehension
An engaging visualisation or visual narrative can help you get your point across far more effectively than detailed tables. And here's the part people often miss: it can actually save time. Forcing yourself to find a suitable visual representation will typically result in you stripping away the waffle — making your point clearer in the process.
The Beautiful Science exhibition demonstrated this across centuries of scientific data: Florence Nightingale's rose diagram of Crimean War deaths, William Farr's cholera charts, weather data rendered as art. In every case, the visual unlocked insight that the table had buried. The same principle applies to your web analytics dashboard or your customer satisfaction tracker — if it takes someone 20 minutes to understand a report, it will not be acted on.