Data & Technology Solutions Ltd.

Measurecamp workshop: Data Visualisation

> > measurecamp workshop data visualisation
Author: Sean Burton
Updated: 07 Aug 2019
Measurecamp workshop: Data Visualisation

Last friday I ran a workshop on Data Visualisation for Measurecamp - here are the slides:

Measurecamp 6 Workshop: Data Visualisation from Sean Burton

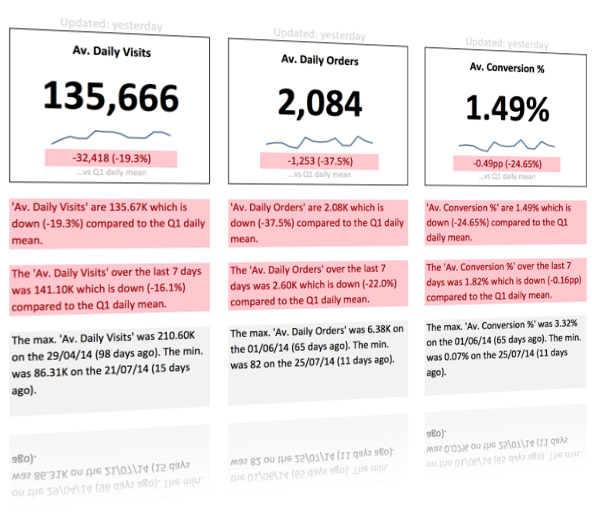
I also showed an example Excel 2010 dashboard schematic, which demonstrated the various best practices that I try to build into all the dashboards I build for my clients, which can be downloaded below:


Comments:


Be the first to comment! Add a new comment below...


Add new comment (subject to moderation):

Full name:  
Email:  
Website:
optional
Article Rating:
optional
? stars
Comment:
optional


We use tracking tools, such as Google Analytics, to optimise this site and to ensure we give you the best possible experience.

You can find out more about how we use cookies and how to manage them on our privacy page.


Accept tracking cookies  |  Decline tracking cookies


Contact us...
feedback icon
We'd love to hear from you...x

Full name*:  
Email*:  
1. Why did you visit us today?
2. How easy did you find this? (Hard:0 | Easy:10)
? out of 10
3. Did you achieve what you wanted?
4. Overall, how would you rate us? (Low:0 | High:10)
? out of 10
5. Any other comments? optional

 
Powered by: